Did you know that each year’s pensions are paid mainly from the contributions of people in work that same year, and only partly from previously accumulated funds? The funding of earnings-related pensions (työeläke) therefore rests on those in work. The pension contribution is one of the largest deductions an employee pays, so it is natural to ask what you get in return.
The figures are public, but few have seen them side by side. I put together four charts from data of the Finnish Centre for Pensions (ETK). They show how the contribution burden and the return are distributed by birth year. This should also make clear why it is fair for today’s pensioners to take part in adjusting public finances.
How does the funding of earnings-related pensions work?
Earnings-related pensions are funded so that each year’s pensions are paid mainly from the contributions of that same year’s employed people. In 2024, about EUR 28 billion in earnings-related pension contributions was collected, and most of it went to paying current pensions. Pensions paid out came to EUR 36 billion, and EUR 7 billion of that was drawn from previously accumulated funds.
Figures as a table
| Year | Contribution |
|---|---|
| 1963 | 4.4% |
| 1964 | 4.7% |
| 1965 | 4.5% |
| 1966 | 4.4% |
| 1967 | 4.3% |
| 1968 | 4.7% |
| 1969 | 5.1% |
| 1970 | 5.0% |
| 1971 | 5.3% |
| 1972 | 6.3% |
| 1973 | 7.5% |
| 1974 | 7.3% |
| 1975 | 8.2% |
| 1976 | 9.7% |
| 1977 | 12.1% |
| 1978 | 10.5% |
| 1979 | 12.1% |
| 1980 | 13.9% |
| 1981 | 13.6% |
| 1982 | 12.3% |
| 1983 | 11.5% |
| 1984 | 11.3% |
| 1985 | 12.3% |
| 1986 | 13.2% |
| 1987 | 13.8% |
| 1988 | 14.6% |
| 1989 | 15.2% |
| 1990 | 18.0% |
| 1991 | 17.5% |
| 1992 | 14.9% |
| 1993 | 18.2% |
| 1994 | 18.7% |
| 1995 | 19.8% |
| 1996 | 20.2% |
| 1997 | 20.0% |
| 1998 | 20.6% |
| 1999 | 20.8% |
| 2000 | 20.0% |
| 2001 | 21.0% |
| 2002 | 21.6% |
| 2003 | 21.1% |
| 2004 | 21.1% |
| 2005 | 20.8% |
| 2006 | 21.1% |
| 2007 | 20.9% |
| 2008 | 21.1% |
| 2009 | 21.1% |
| 2010 | 21.2% |
| 2011 | 21.9% |
| 2012 | 22.7% |
| 2013 | 22.8% |
| 2014 | 23.2% |
| 2015 | 23.9% |
| 2016 | 24.1% |
| 2017 | 24.1% |
| 2018 | 24.1% |
| 2019 | 24.5% |
| 2020 | 22.6% |
| 2021 | 24.2% |
| 2022 | 24.5% |
| 2023 | 24.6% |
| 2024 | 24.6% |
| 2025 | 24.7% |
The 2024 figures come from the ETK report Työeläkkeiden kustannustenjako (cost sharing of earnings-related pensions). The model is called a partially funded pay-as-you-go system, because most of each year’s pensions are paid from that same year’s contributions.
That is why the level of the contribution tells us how much is needed from those in work. Derived from ETK statistics, the private-sector earnings-related pension contribution was about 4 per cent of total payroll in 1963 and about 25 per cent in 2025. The figure includes employer and employee contributions and is not the official contribution rate. The 2025 figure is preliminary, and the dip in 2020 was due to a temporary pandemic-era cut.
Entrepreneurs pay their own YEL contribution (the pension insurance of the self-employed). In the Entrepreneurs’ Day opening of the Market Greens (Markkinavihreät), the pro-market network within the Finnish Greens, we wrote about why YEL must not raise the threshold to entrepreneurship.
Why do fewer and fewer people pay for more and more pensions?
Fewer and fewer employed people pay for more and more pensions, because there are clearly more pension recipients relative to the employed than before. In 1962 there were about 23 national pension (kansaneläke) recipients for every hundred employed people. In 1981 there were about 42 pension recipients per hundred employed, and in 2025 about 60. The definitions of the series differ, so they have not been combined.
- National pensions
- Pension recipients
- ETK projection
Figures as a table
| Year | National pensions | Pension recipients | ETK projection |
|---|---|---|---|
| 1962 | 22.9 | ||
| 1963 | 23.5 | ||
| 1965 | 24.0 | ||
| 1970 | 28.5 | ||
| 1981 | 42.4 | ||
| 1982 | 42.4 | ||
| 1983 | 43.3 | ||
| 1984 | 43.7 | ||
| 1985 | 44.0 | ||
| 1986 | 45.6 | ||
| 1987 | 46.0 | ||
| 1988 | 46.4 | ||
| 1989 | 46.4 | ||
| 1990 | 47.0 | ||
| 1991 | 50.2 | ||
| 1992 | 54.4 | ||
| 1993 | 58.4 | ||
| 1994 | 60.0 | ||
| 1995 | 59.2 | ||
| 1996 | 58.9 | ||
| 1997 | 57.5 | ||
| 1998 | 56.8 | ||
| 1999 | 56.4 | ||
| 2000 | 55.8 | ||
| 2001 | 55.5 | ||
| 2002 | 55.7 | ||
| 2003 | 56.1 | ||
| 2004 | 56.1 | ||
| 2005 | 56.1 | ||
| 2006 | 55.7 | ||
| 2007 | 55.2 | ||
| 2008 | 54.9 | ||
| 2009 | 57.5 | ||
| 2010 | 58.8 | ||
| 2011 | 58.6 | ||
| 2012 | 58.7 | ||
| 2013 | 59.9 | ||
| 2014 | 60.8 | ||
| 2015 | 61.2 | ||
| 2016 | 61.6 | ||
| 2017 | 62.3 | ||
| 2018 | 61.2 | ||
| 2019 | 60.8 | ||
| 2020 | 62.5 | ||
| 2021 | 61.2 | ||
| 2022 | 60.1 | ||
| 2023 | 59.6 | ||
| 2024 | 60.4 | ||
| 2025 | 60.2 | 63.2 | |
| 2030 | 62.5 | ||
| 2035 | 61.1 | ||
| 2040 | 58.7 | ||
| 2060 | 64.6 | ||
| 2080 | 76.7 | ||
| 2100 | 81.8 |
This ratio determines how much each employed person’s contribution has to carry. In ETK’s long-term projection there are 63.2 pension recipients per hundred employed in 2025, and the ratio improves to 58.7 by 2040. In 2100 the projected figure is 81.8. The projection defines the ratio differently from the statistics, which is why its 2025 figure is slightly higher.
How much do you get back for your pension contributions, by birth year?
According to a calculation by the Finnish Centre for Pensions, private-sector employees born in 1940–1960 get their earnings-related pension contributions back as pensions at 2.0 to 4.7 times their value. Those born in 1970–2010 get them back at about 1.7 to 1.8 times. The figures include employer and employee contributions and are adjusted for inflation. The figures for younger cohorts are projections, and the decline levels off at those born around 1975.
- Now of retirement age
- Younger cohorts (projection)
Figures as a table
| Birth year | Pensions ÷ contributions |
|---|---|
| 1940 | 4.7× |
| 1945 | 3.4× |
| 1950 | 2.8× |
| 1955 | 2.3× |
| 1960 | 2.0× |
| 1965 | 1.8× |
| 1970 | 1.8× |
| 1975 | 1.7× |
| 1980 | 1.7× |
| 1985 | 1.8× |
| 1990 | 1.8× |
| 1995 | 1.8× |
| 2000 | 1.8× |
| 2005 | 1.8× |
| 2010 | 1.8× |
When we compare only how much money has been paid into the system and how much comes back out, those born in 1960 or earlier therefore get clearly more than the younger generations.
Those born in 1940–1960 are now of retirement age, meaning that their lowest old-age pension age has been reached by 2026. Some of them are still working. When the oldest of them began their careers in the 1960s, the earnings-related pension contribution was about 4–5 per cent of total payroll.
In ETK’s calculation the average earnings-related pension also grows in real terms for the younger cohorts. For every euro paid in, however, the return is clearly smaller. For those born after 1960 the ratio settles at 1.7–1.8, so the gap between those now of retirement age and everyone born after them is clear.
How does the life expectancy coefficient shift the burden to younger people?
The life expectancy coefficient cuts a new monthly pension more the longer the cohort is expected to live. According to the Finnish Centre for Pensions’ calculation, the cut is 5.5 per cent for those born in 1965 and 12.4 per cent for those born in 2010. The lowest old-age pension age is 65 and 69 years respectively. A longer career offsets much of the cut when people keep working to a higher retirement age.
Figures as a table
| Birth year | Cut, % | Lowest retirement age |
|---|---|---|
| 1965 | 5.5% | 65 y |
| 1970 | 6.2% | 65 y 7 mo |
| 1975 | 7.1% | 66 y 1 mo |
| 1980 | 8.2% | 66 y 6 mo |
| 1985 | 8.9% | 67 y |
| 1990 | 9.7% | 67 y 5 mo |
| 1995 | 10.2% | 67 y 11 mo |
| 2000 | 11.1% | 68 y 3 mo |
| 2005 | 11.7% | 68 y 8 mo |
| 2010 | 12.4% | 69 y |
Rising life expectancy is a good thing, and it is natural that it also shows in working careers. According to ETK, the ratio of pension to pay holds or even improves when a career continues to a higher retirement age. Younger cohorts already secure the system’s sustainability in two ways, through a higher contribution and through a longer career.
Why would freezing the earnings-related pension index be fair?
Freezing the earnings-related pension index would be fair because it would spread the collective effort on public finances across all generations. The pension contribution is already about a quarter of total payroll, and younger cohorts work longer careers for a smaller return. If pensions already being paid also took part, the burden would be shared according to ability to pay, and the working-age population would not carry it alone.
The gap between cohorts in the return and the present contribution of about 25 per cent have already happened. A freeze would spread the burden also to those who no longer pay pension contributions.
That is why the index increases to earnings-related pensions should be frozen for the years 2028–2031. According to the Finnish Centre for Pensions’ calculation, a freeze would reduce pension expenditure by EUR 1.6 billion in 2029 and, at 2025 prices, by EUR 3.0 billion a year by 2031. Lower pension expenditure would make room to lower the earnings-related pension contribution. Those in work would then keep more of their pay. We wrote about how employees can build wealth in the Market Greens opening your paycheck should build wealth. Alternatively, the same room could be taken as income tax and used for the health and social services that an ageing population needs. In neither case would the total burden on work grow. The euro amount of a pension would stay the same, but its purchasing power would weaken by the rate of inflation.
The smallest pensions would be partly protected: the national pension and the guarantee pension (takuueläke, the minimum pension top-up) are currently indexed to the national pension index, and because they shrink as the earnings-related pension grows, they would make up part of the loss. For those on the guarantee pension the compensation would be full.
As I have written, green economic policy cannot be made outside the debt brake. The lasting choices in public finances must be made now, not left to the next generations. If I make it to parliament, I will push the freeze forward so that younger generations too can grow up and live in a welfare state.
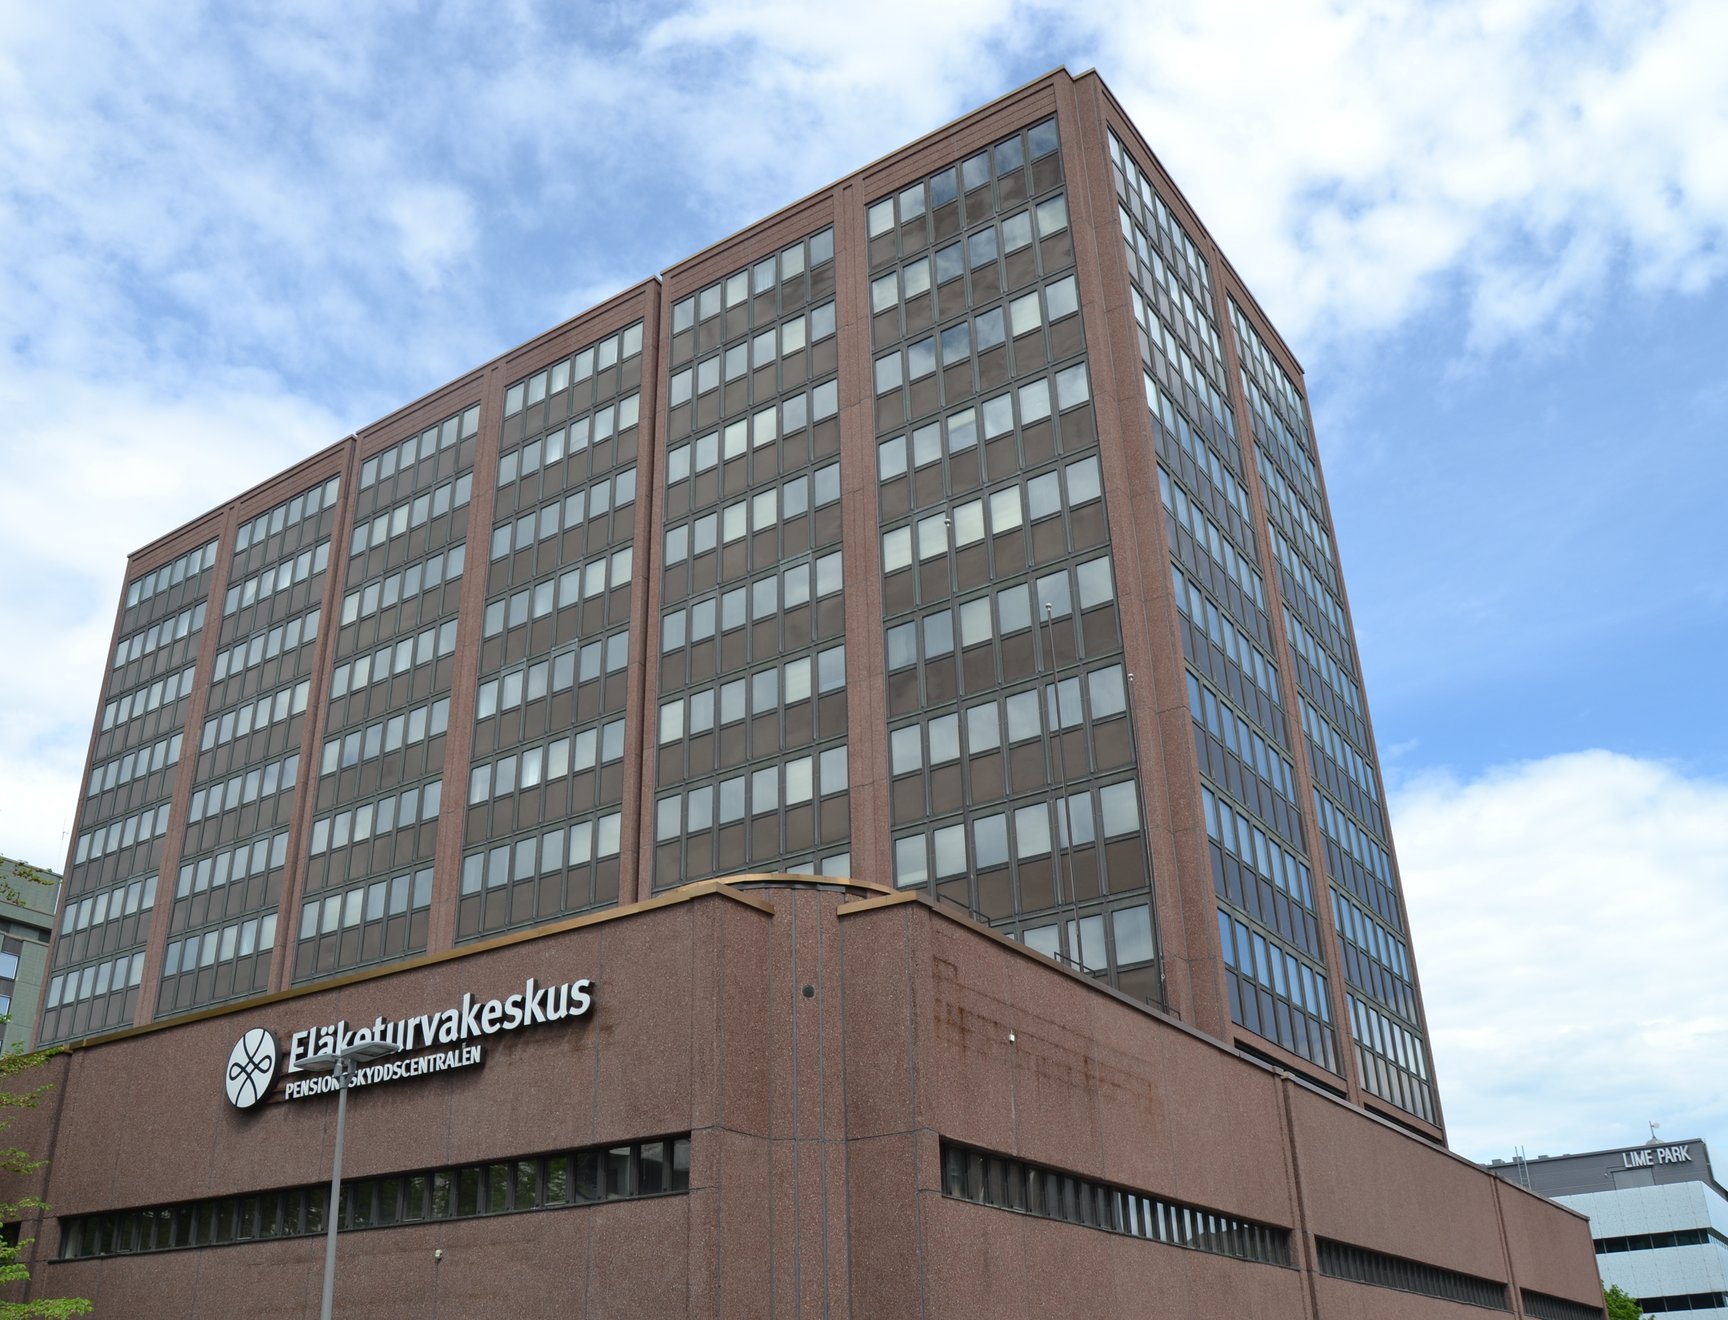
Cover photo: “Finnish Centre for Pensions building”, Antti Leppänen, CC BY 4.0, modified.
Frequently asked questions
How does the funding of earnings-related pensions work?
Each year's earnings-related pensions are paid mainly from the contributions of that same year's employed people. In 2024, about EUR 28 billion in contributions was collected, and most of it went to paying current pensions. Pensions paid out came to EUR 36 billion, and EUR 7 billion of that was drawn from previously accumulated funds.
Why do fewer and fewer people pay for more and more pensions?
Fewer and fewer employed people pay for more and more pensions because there are clearly more pension recipients relative to the employed than before. In 1962 there were about 23 national pension recipients for every hundred employed people. In 1981 there were about 42 pension recipients per hundred employed, and in 2025 about 60. The definitions of the series differ, so they have not been combined.
How much do you get back for your pension contributions, by birth year?
According to a calculation by the Finnish Centre for Pensions (ETK), private-sector employees born in 1940–1960 get their earnings-related pension contributions back as pensions at 2.0 to 4.7 times their value. Those born in 1970–2010 get them back at about 1.7 to 1.8 times. The figures include employer and employee contributions and are adjusted for inflation. The figures for younger cohorts are projections, and the decline levels off at those born around 1975.
How does the life expectancy coefficient shift the burden to younger people?
The life expectancy coefficient cuts a new monthly pension more the longer the cohort is expected to live. According to ETK's calculation, the cut is 5.5 per cent for those born in 1965 and 12.4 per cent for those born in 2010. The lowest old-age pension age is 65 and 69 years respectively. A longer career offsets much of the cut when people keep working to a higher retirement age.
Why would freezing the earnings-related pension index be fair?
Freezing the earnings-related pension index would be fair because it would spread the collective effort on public finances across all generations. The pension contribution is already about a quarter of total payroll, and younger cohorts work longer careers for a smaller return. If pensions already being paid also took part, the burden would be shared according to ability to pay, and the working-age population would not carry it alone.
Other posts
-
Where does the public sector's money come from and where does it go?
The public sector collects an estimated €160bn in 2027 and spends €174bn. See the charts for where the money comes from and where it goes.
-
Green economic policy requires a seat at the table
Leaving the debt-brake agreement does not change the scale of fiscal adjustment — it removes the Greens from shaping how the adjustment is done.
-
Sote is the cornerstone of the welfare society
Social and healthcare is expensive, but essential. Without a functioning welfare system, can we still call Finland a welfare state?